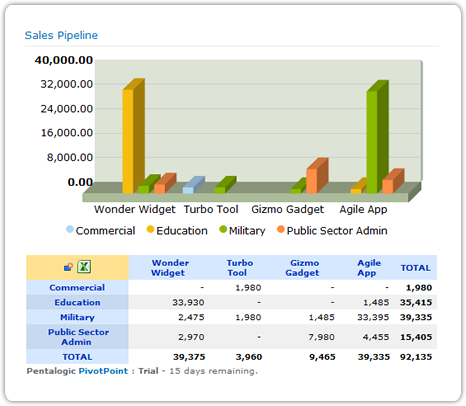


Pivot Charts and Pivot Tables Together
 Pivot Charts are great for giving an at a glance
visual representation of your data.
And Pivot Tables are what you need if you want to see your data in detail.
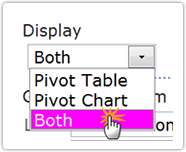
With PivotPoint you don’t need to make a choice between the two. If you want you can display your data as a Pivot Chart and a Pivot Table on the same SharePoint page.
So you have both the overview and the detail at our fingertips.